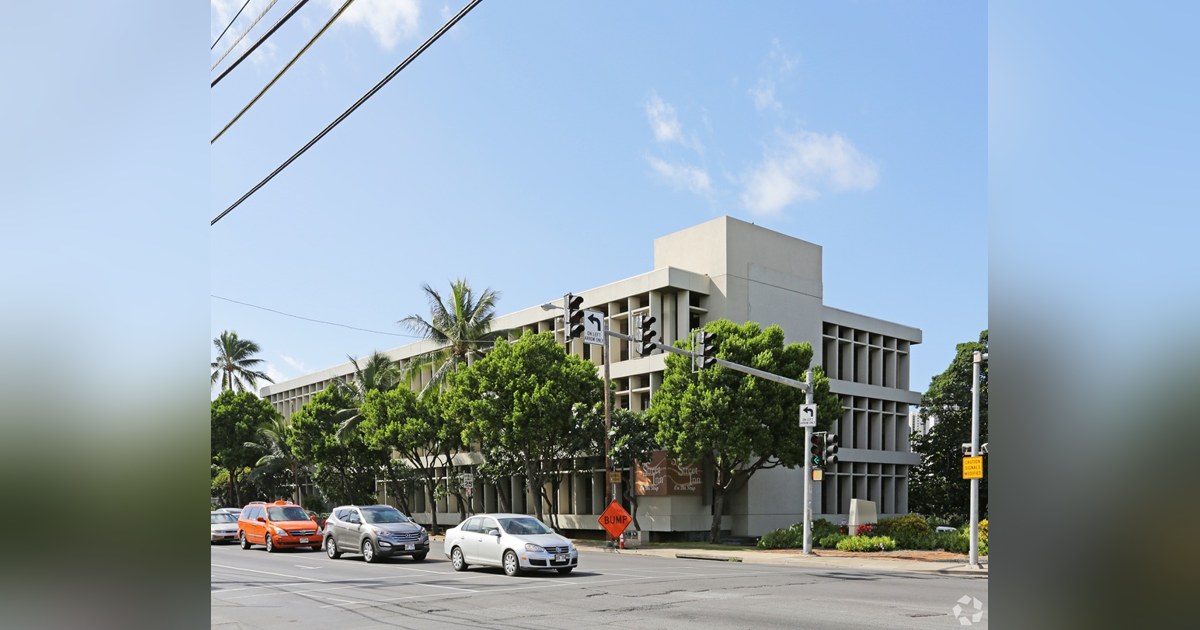
Two 20,000-square-foot office buildings in the same Hawaii city, with similar tenancy, can trade hundreds of basis points apart. The divergence is not random; it stems from four identifiable factors that investors must underwrite: physical condition, leasehold versus fee simple interest, scale in multifamily, and the site visit.
Physical condition is the most common explanation, but it really measures future capital expenditure. Elevators, roofing, plumbing, and electrical systems all require outlays that buyers price into their offers. “You can quickly spend lots of money on any of these assets,” says Mark D. Bratton, CCIM, of The Bratton Team at Colliers International Hawaii. With construction costs elevated, the expected spend can materially alter bids. Newer buildings carry a premium because their capital needs sit years out.
The largest single driver of spread in Hawaii is tenure: fee simple versus leasehold. More than half of investors will not consider leasehold under any conditions, which narrows the buyer pool and moves pricing. Bratton estimates the differential at roughly 200 basis points: where a fee simple building prices at 6.75 percent, the leasehold equivalent might start around 8.75 percent. However, leasehold is not monolithic. A building with two years remaining before reversion differs vastly from one with 99 years at nominal rent.
For leasehold assets, the ground rent reset terms are critical. The conventional Hawaii structure runs about 60 years, with the first 30 fixed and renegotiation to fair market value at ten-year intervals. That structure allows a lessee to amortize construction costs, repay lenders, and earn a return. Shorter terms suit different situations, such as an owner-user selling and leasing back with a ten-year term and extension flexibility. The analytical question remains whether returns are adequate for the risk the structure creates. Assets of both kinds appear across current Hawaii commercial inventory.
In multifamily, Hawaii presents a size paradox. Smaller buildings often trade at lower cap rates because a deep buyer pool understands them and can self-manage. A recently traded 23-unit building in excellent condition priced at about a five cap on a roughly $10 million basis. A 400-unit building sold earlier this year at a considerably higher cap rate, because a $200 million transaction has far fewer possible buyers. For middle-market investors, the competitive advantage sits with the smaller check.
Cap rate comparisons across asset classes reveal less than they appear to, because each class carries a different risk structure. A hotel reprices nightly and depends on tourism and airlift; a building leased to a creditworthy tenant on a 20-year leaseback requires almost nothing of its owner. Multifamily sits at the lower end of the yield range, office at the higher end, reflecting perceived risk. Comparisons are most useful within an asset class or with the risk difference explicitly stated.
The step most buyers skip is the least technical but most underweighted. “Go touch them, go feel them, go walk them,” Bratton says of buildings that look equivalent on paper. Access, egress, circulation, road conditions, and site functionality are differences that do not appear in an offering memorandum. Sight-unseen acquisitions still happen, though far less than in the 1980s, and most buyers now send a representative or arrange a video walkthrough. Bratton maintains that the visit repays the time, because being on site surfaces details nothing else does. Having walked a building years ago and again today is its own form of information, and it is the practical case for local representation over remote.
For anyone pricing Hawaii assets, the composite lesson is that the spread between two similar buildings is rarely arbitrary. It is condition, tenure, scale, and what the walkthrough revealed. Recently closed transactions show how those variables resolve in practice.